
Welcome to the realm of statistics, where data transforms into knowledge and empowers informed decision-making. Join us as we delve into AP Stats Chapter 1 Review, an exploration of the fundamental concepts that lay the groundwork for statistical thinking. From data exploration to probability and sampling, we’ll uncover the secrets of data analysis and its transformative power in various fields.
Throughout this review, we’ll navigate the intricacies of data, probability, and statistical inference. We’ll discover how to harness the power of data to make informed decisions, understand the world around us, and prepare for success in the AP Statistics exam.
Introduction
AP Statistics Chapter 1 introduces the fundamental concepts and methods of statistical reasoning. It lays the groundwork for understanding the collection, analysis, and interpretation of data, which are essential skills for making informed decisions in various fields.
A chapter review is crucial for reinforcing these foundational concepts, assessing your understanding, and preparing you for subsequent chapters. By reviewing the key ideas and practicing the techniques presented in Chapter 1, you can solidify your knowledge and enhance your ability to apply statistical principles in real-world situations.
Types of Data
Chapter 1 distinguishes between two main types of data: qualitative and quantitative. Qualitative data describes non-numerical characteristics, while quantitative data involves numerical measurements. Understanding the distinction between these data types is essential for selecting appropriate statistical methods and interpreting results accurately.
- Qualitative Data:Describes non-numerical attributes or categories, such as gender, color, or occupation.
- Quantitative Data:Consists of numerical measurements, such as height, weight, or income.
Data Collection Methods
Chapter 1 emphasizes the importance of using appropriate data collection methods to ensure the accuracy and reliability of your data. Various methods are available, each with its advantages and limitations.
- Observational Studies:Researchers observe and record data without manipulating the variables.
- Experimental Studies:Researchers manipulate one or more variables to determine their effect on the outcome.
- Surveys:Participants are asked questions to gather information.
- Sampling:A subset of the population is selected to represent the entire population.
Data and Statistical Thinking
Data is the foundation of statistics, and statistical thinking is the process of using data to make informed decisions. In this chapter, we will explore the different types of data, the principles of statistical thinking, and how data can be used to solve real-world problems.
Types of Data
There are two main types of data: quantitative and qualitative. Quantitative data is numerical and can be measured or counted. Qualitative data is non-numerical and describes qualities or characteristics.
- Quantitative dataincludes measurements such as height, weight, and temperature. It can be further classified into two types:
- Discrete datatakes on only specific values, such as the number of people in a room or the number of goals scored in a soccer game.
- Continuous datacan take on any value within a range, such as the height of a person or the temperature of a room.
- Qualitative datadescribes qualities or characteristics, such as eye color, hair color, or job title. It can be further classified into two types:
- Nominal datais used to categorize data into different groups, such as gender or race.
- Ordinal datais used to rank data in order, such as the level of education or the severity of a disease.
Statistical Thinking
Statistical thinking is the process of using data to make informed decisions. It involves the following steps:
- Collecting data: The first step is to collect data that is relevant to the question you are trying to answer.
- Analyzing data: Once you have collected data, you need to analyze it to find patterns and trends.
- Drawing conclusions: Based on your analysis, you can draw conclusions about the data and make informed decisions.
Examples of Using Data
Data can be used to make informed decisions in a variety of areas, including:
- Business: Data can be used to track sales, identify trends, and make decisions about marketing and product development.
- Healthcare: Data can be used to track patient outcomes, identify risk factors, and develop new treatments.
- Education: Data can be used to track student progress, identify areas where students need help, and make decisions about curriculum and teaching methods.
Exploring Univariate Data
Univariate data analysis focuses on understanding the distribution and characteristics of a single variable. Exploring univariate data involves using various methods to identify patterns, trends, and outliers.Data visualization plays a crucial role in understanding univariate distributions. Graphical representations, such as histograms, box plots, and scatterplots, provide insights into the shape, center, spread, and potential relationships within the data.
Methods for Exploring Univariate Data
* Graphs: Histograms, box plots, and scatterplots are common graphical methods used to visualize univariate data. These graphs help identify patterns, trends, and outliers.
Summary Statistics
Measures like mean, median, mode, range, and standard deviation provide numerical summaries of data distribution. They help quantify central tendency, spread, and variability.
Identifying Patterns, Trends, and Outliers
* Patterns: Examining data visually or numerically can reveal patterns, such as linear or nonlinear trends, cycles, or seasonal variations.
Trends
Trends indicate the overall direction or movement of data over time or across different categories.
To brush up on the basics of AP Stats Chapter 1, it’s helpful to review the chemical name of mg h2po3 2 , which is magnesium hydrogen phosphite. This can help solidify the concepts of probability and sampling distributions, which are key topics in the chapter.
Understanding the chemical formula and name provides a practical application of the statistical principles being studied.
Outliers
Outliers are extreme values that deviate significantly from the rest of the data. They can indicate errors, unusual observations, or important insights.
Importance of Data Visualization
Data visualization enables us to:* Understand Distributions: Visualizations help us grasp the shape, spread, and symmetry of data distributions.
Identify Patterns and Trends
Graphs make it easier to spot patterns, trends, and relationships that may not be apparent from numerical summaries alone.
Detect Outliers
Visualizations highlight outliers that may require further investigation or removal.
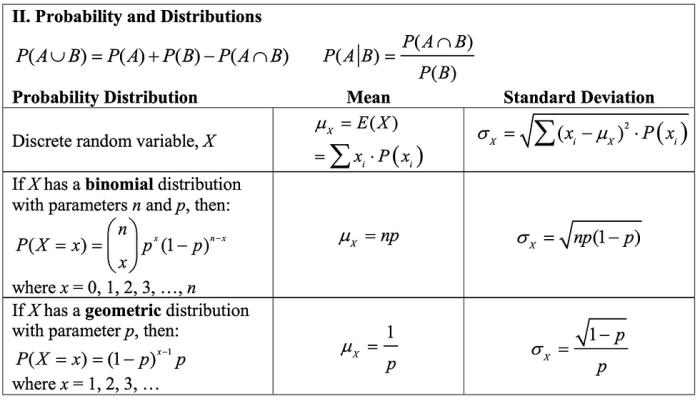
Probability and Random Variables
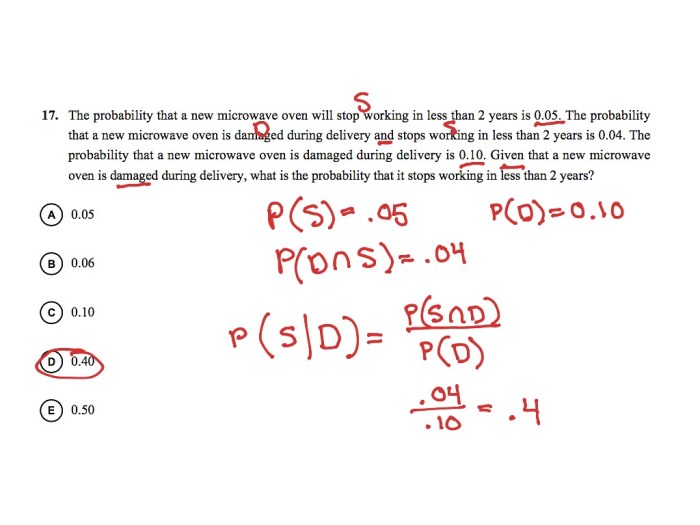
Probability is a fundamental concept in statistics that measures the likelihood of an event occurring. It plays a crucial role in understanding the behavior of random variables, which are mathematical constructs that represent the outcomes of random experiments.
The probability of an event is a number between 0 and 1, where 0 represents an impossible event and 1 represents a certain event. The sum of the probabilities of all possible outcomes of an experiment must equal 1.
Random Variables
A random variable is a function that assigns a numerical value to each outcome of a random experiment. The probability distribution of a random variable describes the probability of each possible value that the random variable can take.
Types of Probability Distributions
- Discrete Probability Distributions:Assign probabilities to individual values (e.g., binomial distribution, Poisson distribution).
- Continuous Probability Distributions:Assign probabilities to ranges of values (e.g., normal distribution, uniform distribution).
Applications of Probability Distributions
- Predicting the outcome of future events (e.g., weather forecasting).
- Estimating population parameters (e.g., mean, standard deviation).
- Testing hypotheses about population characteristics.
Sampling and Estimation
Sampling is the process of selecting a subset of a population to make inferences about the entire population. It plays a crucial role in statistical inference, allowing us to draw conclusions about a larger group based on a smaller sample.
There are various sampling methods, each with its advantages and disadvantages. Simple random sampling involves selecting each individual in the population with equal probability. Systematic sampling selects individuals at regular intervals from a list. Stratified sampling divides the population into subgroups (strata) and selects individuals from each stratum.
Cluster sampling selects groups (clusters) of individuals rather than individuals themselves.
Estimating Population Parameters
Once a sample has been collected, we can use it to estimate population parameters, such as the mean, proportion, or standard deviation. These estimates are based on sample statistics, which are calculated from the sample data.
For example, the sample mean is an estimate of the population mean. It is calculated by adding up all the values in the sample and dividing by the number of values. The sample proportion is an estimate of the population proportion.
It is calculated by dividing the number of individuals in the sample with a certain characteristic by the total number of individuals in the sample.
The formula for the sample mean is:$$\barx = \frac1n\sum_i=1^n x_i$$where $\barx$ is the sample mean, $n$ is the sample size, and $x_i$ is the $i$th value in the sample.
The formula for the sample proportion is:$$\hatp = \fracxn$$where $\hatp$ is the sample proportion, $x$ is the number of individuals in the sample with the characteristic of interest, and $n$ is the sample size.
Confidence Intervals: Ap Stats Chapter 1 Review
Confidence intervals are a statistical tool used to estimate the true value of a population parameter based on sample data. They provide a range of plausible values within which the parameter is likely to fall.
Constructing Confidence Intervals
To construct a confidence interval, we use the sample mean and standard deviation to calculate the margin of error. The margin of error is then added and subtracted from the sample mean to obtain the upper and lower bounds of the confidence interval.
The formula for the margin of error is:“`Margin of Error = z
(Standard Deviation / Square Root of Sample Size)
“`where z is the z-score corresponding to the desired confidence level.
Interpretation and Limitations
Confidence intervals provide a range of plausible values for the population parameter, but it is important to note that they are not guaranteed to contain the true value. The confidence level represents the probability that the true value falls within the interval.The
width of the confidence interval is inversely proportional to the sample size. Larger sample sizes result in narrower confidence intervals, indicating greater precision in the estimate.
Hypothesis Testing
Hypothesis testing is a statistical method used to determine whether there is sufficient evidence to reject a claim about a population parameter. It involves formulating a hypothesis, collecting data, and using statistical tests to determine the probability of obtaining the observed data if the hypothesis is true.
Types of Hypotheses
There are two types of hypotheses in hypothesis testing:
- Null hypothesis (H0): The claim or assumption being tested.
- Alternative hypothesis (H1): The claim or assumption that contradicts the null hypothesis.
Steps in Hypothesis Testing, Ap stats chapter 1 review
The steps involved in hypothesis testing are:
- State the null and alternative hypotheses.
- Set a significance level (α).
- Collect data and calculate the test statistic.
- Determine the p-value.
- Make a decision: Reject or fail to reject the null hypothesis.
Role of P-Values
The p-value is the probability of obtaining the observed data or more extreme data, assuming the null hypothesis is true. A low p-value indicates that the observed data is unlikely to occur if the null hypothesis is true, providing evidence against the null hypothesis.
Additional Topics
In addition to the core concepts covered in Chapter 1 of AP Statistics, there are a few additional topics that may be addressed.
Categorical Data Analysis
Categorical data analysis involves the analysis of data that falls into specific categories or groups. It is used to identify patterns and relationships between different categories and to make inferences about the population from which the data was collected.
- Example: A survey may collect data on the favorite color of respondents. The data can be analyzed to determine the most popular color, the distribution of preferences across different categories, and the relationship between color preference and other factors.
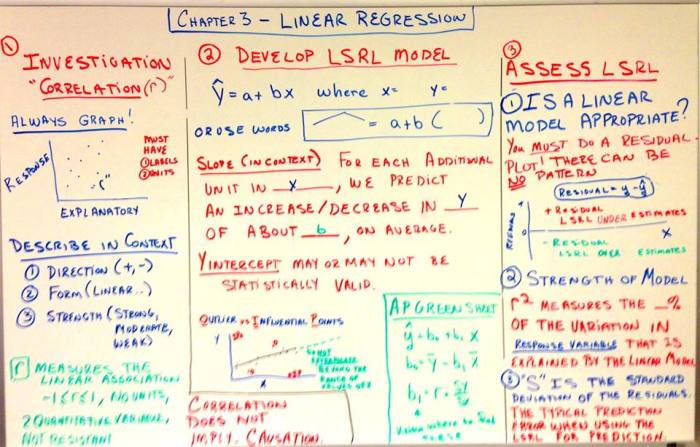
Regression
Regression analysis is a statistical technique used to model the relationship between a dependent variable and one or more independent variables. It allows us to make predictions about the dependent variable based on the values of the independent variables.
- Example: A company may use regression analysis to predict sales based on factors such as advertising spending, product price, and seasonality. The model can be used to optimize marketing strategies and forecast future sales.
Q&A
What is the purpose of AP Stats Chapter 1 Review?
AP Stats Chapter 1 Review provides a comprehensive overview of the foundational concepts of statistics, preparing students for success in the AP Statistics exam and beyond.
What topics are covered in AP Stats Chapter 1?
Chapter 1 covers a wide range of topics, including data and statistical thinking, exploring univariate data, probability and random variables, sampling and estimation, and confidence intervals.
How can I prepare for the AP Stats exam using this review?
This review serves as an excellent resource for exam preparation, providing clear explanations, practice problems, and insights into the key concepts tested on the exam.
